About the project
Why this, why now?
The heated context, the missing shared vision, a short policy summary, and that it’s a learning cycle.
In recent years, Oxfordshire’s streets have become some of the most hotly debated places in the country. Low traffic neighbourhoods, traffic filters and the congestion charge have divided opinion, and we’ve been in the thick of it. Britain’s most hated, and loved, bollard is around the corner from OLS HQ.
Future Streets Oxfordshire is a conscious step away from those culture wars, to ask ourselves some challenging questions. What are we aiming for here? What is a liveable street and what does it feel like to be part of?
Because even the best solutions need a story of change to aim for - or a vision.
At the moment, that’s missing. It’s missing from Oxfordshire Liveable Streets as a campaigning organisation and it’s missing from the Coalition we’re part of. And although this county has great ambition written into its policies, there’s currently no shared picture, built by the people who live here, of what we’re working towards.
Future Streets is also the first co-design process OLS has led, and we designed it as a learning cycle - to really listen to what people want from their places.
But there’s another big reason for now. Big change is a-foot on the horizon in council structures and how decisions are made. And the policy direction of travel all point to the need for building and operationalising a shared vision that intersects with place and transport.
Read more
Policy in Oxfordshire increasingly points to the need for a shared vision of place.
- The 2023 Citizens’ Assembly on transport called for the deeper involvement of communities in transport policy, scheme design and delivery.
- Decide and Provide, adopted by Oxfordshire County Council, commits to deciding on a preferred vision first, then providing the means to work towards it.
- Local government reorganisation will reshape how services are organised around place, whatever form it takes.
Civil society has a role to play in bringing that vision forth. Future Streets offers a community-grounded picture of what “better” looks like, built from the bottom up.
What kind of vision is this?
When people hear the word ‘vision’ they often think ‘vision statement’ or an illustrated visualisation. This work isn’t that. Over four in-depth workshops, with considerable work in between, we have worked collectively to co-create a vision of thriving streets and neighbourhoods that work for everyone brought to life through bottom-up, community-led indicators.
We asked people questions like, ‘what do you love about your place?’ and ‘what do you want more of? Less of?’ And the all-powerful ‘what if?’. In groups, after we had answers to these questions, workshop participants then identified core territories for the indicators.
We think of them as narratives of how people want to experience their streets and neighbourhoods. They give us the stories of change we’re working toward. Individually, and collectively, they describe a vision of place deeply rooted in current and desired lived experience.
We have used some illustrations to help lift the words off the page, but we’ve been very deliberate in not creating a vision as fixed visualisation - this feels like something that needs to be place-based. A single picture can’t be true for Banbury, Blackbird Leys and Chipping Norton at once. This allows opportunity for each place to imagine how these indicators might appear in reality in their own streets and neighbourhoods.
How are these different from other indicators?
Current institutional indicators for Oxfordshire that intersect our work include the healthy life expectancy gap, collision data, numbers of children seriously injured on roads, and years of healthy life lost to air pollution. These are important measures. But they are designed to track harm reduction, not human flourishing and largely chosen because of available, trackable data sets. They tell us whether things are getting less bad. They don’t tell us what good actually looks and feels like to the people who live here.
Community-led indicators are designed to sit alongside these measures, not replace them. Where official indicators rightly focus on reducing harm, community-led indicators like the ones we’ve developed describe what getting it right looks and feels like: the signals of change noticed by the people living through it. They can become a shared language for what progress means at street and neighbourhood level, a springboard for advocacy, and a reference point for decisions made by businesses, community organisations and local government alike.
Our approach builds on Cornerstone Indicators, a methodology developed by Dark Matter Labs from an idea seeded by wellbeing economist Katherine Trebeck. Her original inspiration was girls riding their bikes to school. The idea is that indicators developed with communities, rather than for them, capture what people genuinely care about. The aim is to move conversations about progress out of policy documents and into the cafes, playgrounds and bus queues of everyday life.
Read more: How we shaped the indicators
From territories to indicators
In workshops 3, groups identified territories for the indicators across six themes that had emerged from workshops 1 and 2. We then shaped the wording, staying true to what participants had surfaced, and checked the set against the themes to see where it was thick and where it was thin. Workshop 4 was redesigned to go after the thin areas. Where gaps remained, we drew new indicators directly from what people had said in earlier workshops. Nothing was invented to plug a hole.
The tests we used
Every indicator was developed and tested against five framing rules of our own, each with a plain test:
- Experiential and people focused. Does it describe something a person experiences or does, rather than something that exists or is provided?
- Indicative, not causal. Does it point to a condition worth noticing, without implying that one intervention caused it, or that tracking it is an action plan?
- Trackable and noticeable. Could someone walking through a neighbourhood notice whether it is present or absent, without a clipboard or a dataset?
- Simple and intuitive. Can someone who has never heard of the project read it and immediately understand what it points at, and does it land emotionally, not just intellectually?
- Universal by default, specific by intent. If it names a group, is that because their distinct barrier is the point, and is it written from inside that experience?
These build on the five Cornerstone Indicators criteria developed by Dark Matter Labs: indicators should be co-designed by the people who will use them; non-linear, reflecting how complex things interact; intuitive, understood at a glance; streamlined, drawing many inputs into one clear signal; and complementary, sitting alongside scientific measurement rather than replacing it.
Take one: children walking or cycling to school without an adult. Experiential. Noticeable. Trackable. Simple enough that it needs no explanation. And it takes safe streets, good routes, access to bikes and skills, and trust between neighbours to make it happen. If a child can move through a street freely, that street usually works for everyone. It came directly from what participants said in the first workshops, and we then used it as a worked example when people began designing their own.
Equity and safety as lenses
Equity and safety emerged as cross-cutting themes across all indicators. Through considerable stress-testing of the indicators themselves we landed on the realisation that equity and safety should act as lenses we apply when we read and use an indicator. If the indicator names a universal lived experience, the lens then asks who that experience is true for, and where, by income, age, disability, tenure, ethnicity, migration status and more. It opens the real questions: who has access, who benefits, and who is disadvantaged. The lens shapes how we look at the thing, not the shape of the thing itself. This keeps the indicators natural to read, and, critically, provides a mechanism for embedding equity into practice, and responsibility to operationalise the outputs.
Where did we start from?
We didn’t start from crises. It wasn’t an easy decision at the time to let go of the idea of introducing everything that was problematic about our streets and neighbourhoods in Oxfordshire. We didn’t mention climate, nature loss, collisions, water scarcity, harmful particulate matter in the air, obesity or, even, wait for it, traffic.
We made a commitment to trust the process and lean into what we heard.
But we did have to be transparent and clear about the frame, because of course, nothing is neutral.
So, at the beginning of every workshop we shared two beliefs:
- That streets and neighbourhoods can be places for human flourishing
- That we believed they could work better for more people
Beyond that, we stepped back. We didn’t know what would come out of it. And although that was a healthy place to start, truth be told, this was a little hair-raising. What if we didn’t agree with what people were saying? What if it felt out of our control and reach? And what if people argued?
As it turned out, what we found was staggering common ground. Far more than we expected. And whilst of course there was nuance and difference, what we found across the arc of the workshops, whether from Blackbird Leys, Chipping Norton or Thame, is that many people actually do want the same things.
So. What people shared shaped what came next, from the themes to the indicators themselves.
The journey. How did it unfold?
Future Streets was designed as a learning cycle. Four workshops between March and June 2026, each building on the last, with a lot of work in between. Some people came to one, others to several.
- 1. Understanding our streets today (March, online). What do people love about where they live, what would they let go of, and what’s missing?
- 2. Future visions with Rob Hopkins (April, Oxford Town Hall). A full day of collective imagination, travelling forward to streets and neighbourhoods that work for everyone.
- 3 and 4. Discovering signals of change (May and June, online). Participants identified the territories the indicators needed to cover.
- Testing for resonance (summer). 120 people travelled through the draft indicators online and told us whether they rang true.
- 5. Bringing the future into the present (12 November, central Oxford). This is the launch moment and time to consider enabling conditions.
Read more: How the process was designed
The workshops were iterative by design. What came out of workshop 1 shaped workshop 2, and workshops 3 and 4 weren’t possible without the participant data from the workshops before them.
That meant anyone could join at any point. Some people came to every workshop, others to just one. But whoever was in the room was working with what other people had shared before them, and that came with a responsibility: to build on those experiences and imaginings, not start again from their own.
We were open about how this worked from the outset. Individual experiences and imaginings became shared themes, with AI helping the team with early sorting and human analysis shaping what came out. Shared themes became the indicators. And the indicators were then tested with a wider group.
Who took part?
Scope. Early in the process, we decided on creating a vision for Oxfordshire as a whole, with an early focus on Oxford and the key market towns for outreach to help narrow scope. However, people from smaller towns and villages across the county took part too, and their voices directly shaped the themes, factors, and indicators.
Our goal. We aimed for a range of people across the workshop series as a whole, rather than try to make every session representative. This allowed for a flexible approach to participation so people could join the workshops that most suited them. We measured participation against census figures for Oxford and Oxfordshire. Anyone who wanted to take part could, and we turned no one away, but we were deliberate about filling the gaps when they became known to us.
How we tracked it. At each workshop we asked a few short questions about who was in the room, shared the results on screen, and asked together: who isn’t here? That shaped where we went next.
What it led to. It informed both who we reached and how. Workshop 1 became an online survey, which worked better for young people with disabilities, and a conversation in Blackbird Leys at the invitation of Integrate CIC. We reached out to Banbury and Didcot. Pupils from Chipping Norton secondary school joined Workshop 2, and around 260 Key Stage 2 children at Windmill School in Headington took part in an interactive assembly that condensed the visioning and indicator design into one session. One of the indicators came directly from it.
Read more: The numbers, and the gaps
In all, there were more than 500 engagements between March and October: about 130 people across the four workshops (some came to more than one), 120 who tested the draft indicators online, and around 260 children at Windmill School.
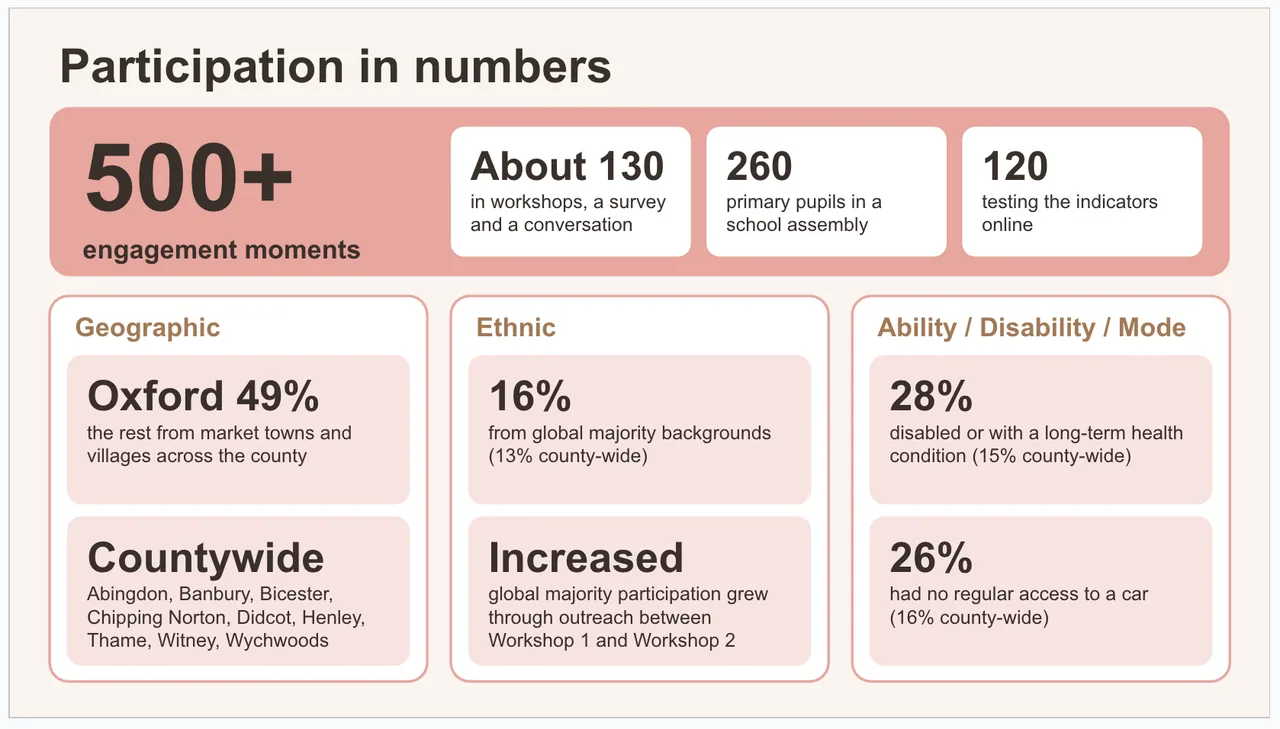
Not everyone who came to a workshop answered our demographic questions, so the percentages are based on the people who did: about 106 of the 130. The first workshop was entirely white, mostly homeowners, with no one aged 18 to 30. The figures on disability and car access came from deliberate outreach, reaching the people whose daily lives are most shaped by how streets are designed.
Testing the indicators online reached Didcot for the first time, and more people who rent privately or live in villages.
There were gaps. The workshops leaned older and more settled than the county, and under-30s and renters were under-represented. Measured against Oxford alone, where around three in ten people are from global majority backgrounds and a third rent privately, both groups were under-represented. We’ve noted these gaps transparently. And because this work isn’t fixed in time, they show us where to go next as the indicators and the methodology are taken into new places and conversations.
Who made it happen?
Future Streets is an OLS pilot in partnership working. It is a collaboration between Oxfordshire Liveable Streets, the Green Futures Network at the University of Exeter and Citizen Architects, with support from freelance specialists in futures thinking, illustration and design.
Everyone on the core team had worked through the Cornerstone Indicators method together over six months in a community of practice before the workshops began. Each brought a different lens to it.
Oxfordshire Liveable Streets led and stewarded the project. OLS publishes what came out of the work, but the indicators are co-authored with the people who took part.
- Siobhann Mansel-Pleydell, Managing Director, held the strategy and direction, supported by the OLS board and members of the Coalition for Healthy Streets and Active Travel.
- Suyash Sinha was the connecting thread across the series: analysing what emerged from each workshop, designing the participation experience and resonance testing, and building this site. He is a designer and futures thinker with an MA from the Royal College of Art.
Green Futures Network, University of Exeter. Peter Lefort was lead facilitator for Workshops 1, 3 and 4. A systems thinker who makes complex ideas usable through playful, structured methods, he works with people across different systems and scales to spot patterns and better understand how to influence change.
Citizen Architects. Elisa Engel and Katherine Leat led on participatory design, shaping how people were invited in and how power was handled in the room. They bring more than 20 years’ experience of inclusive engagement in complex public settings, with oversight from Architecture Sans Frontières UK. They are leading Workshop 5.
Freelance support
- Rob Hopkins led Workshop 2, a day of collective time travel. He co-founded the Transition movement, pioneered the Time Travel method, and is the author of How to Fall in Love with the Future.
- Richard Carman, an architect and illustrator working in watercolour, ink and crayon, captured people’s ideas live as they emerged during workshop 2.
- Jaś Lewicki created the imagery for the indicators, working directly from the raw workshop material: participants’ own words from the post-it notes, the collages from Workshop 2, and Richard’s illustrations. A graphic designer with a background spanning architecture, international development and activism, he has long worked with environmental, climate, social justice and human rights organisations based right here in Oxfordshire.
With thanks to the volunteer facilitators from the Cornerstone Indicators community of practice who joined us from across the UK and beyond to run breakout rooms: Sophia, Kath, Nik, Miso, Zemina, Maria and Shrada. And to Hannah Kirby, OLS director and lawyer specialising in data and compliance, who oversaw how participants’ information was collected and stored.
Future Streets was funded by a private local donor.
What’s the thinking behind it?
Future Streets Oxfordshire draws on several ideas and frameworks from systems change. You don’t need to understand or know any of them to use the indicators, but they shaped how the work was designed. Future Streets Oxfordshire is systems informed: it treats streets as part of a wider web of health, nature, local life and decision-making, rather than as a transport problem on its own. This thinking has sat in the background to date.
The Positive tipping Points Framework. This is where Future Streets began. The idea is that systems sometimes shift quickly rather than slowly, and that the conditions for those shifts can be cultivated. Two things help: a clear picture of where you’re heading, and signs that tell you whether you’re getting there. Future Streets grew from a prototype tool developed for the Positive Tipping Points toolkit which was launched at The University of Exeter’s Global Tipping Points Conference in 2025. In those terms, the indicators describe the future people want, and Workshop 5 begins to ask what it would take to start moving towards it.
Cornerstone Indicators. This is the method behind the indicator development: an open-source framework, developed by Dark Matter Labs, for co-creating indicators that fit a particular place. The idea was seeded by wellbeing economist Katherine Trebeck, co-founder of the Wellbeing Economy Alliance. Her favourite example is the number of girls who ride their bikes to school, because, as she puts it, “a lot of things have to go right in the wider context to enable girls to do this.” Our own foundation indicator, ‘children walking or cycling to school without an adult’, came independently from Oxfordshire participants.
The indicators sit alongside existing measures rather than replacing them, turning complex information into short, easy-to-read stories of change. They can be used for advocacy, local investment, engaging residents and evaluating policy. We’ve described how we adapted the method in What kind of vision is this?
Find out more at cornerstoneindicators.com
Theory U. Otto Scharmer’s Theory U describes how groups move through a U-shaped process of change. The workshop series follows that arc: understanding our streets today (Workshop 1), imagining the future (Workshop 2), shaping the indicators (Workshops 3 and 4), and bringing the future into the present (Workshop 5). That makes this a beginning, not an end. The indicators mark the point where we start climbing the right-hand side of the U, and the real work of bringing them to life is still ahead.
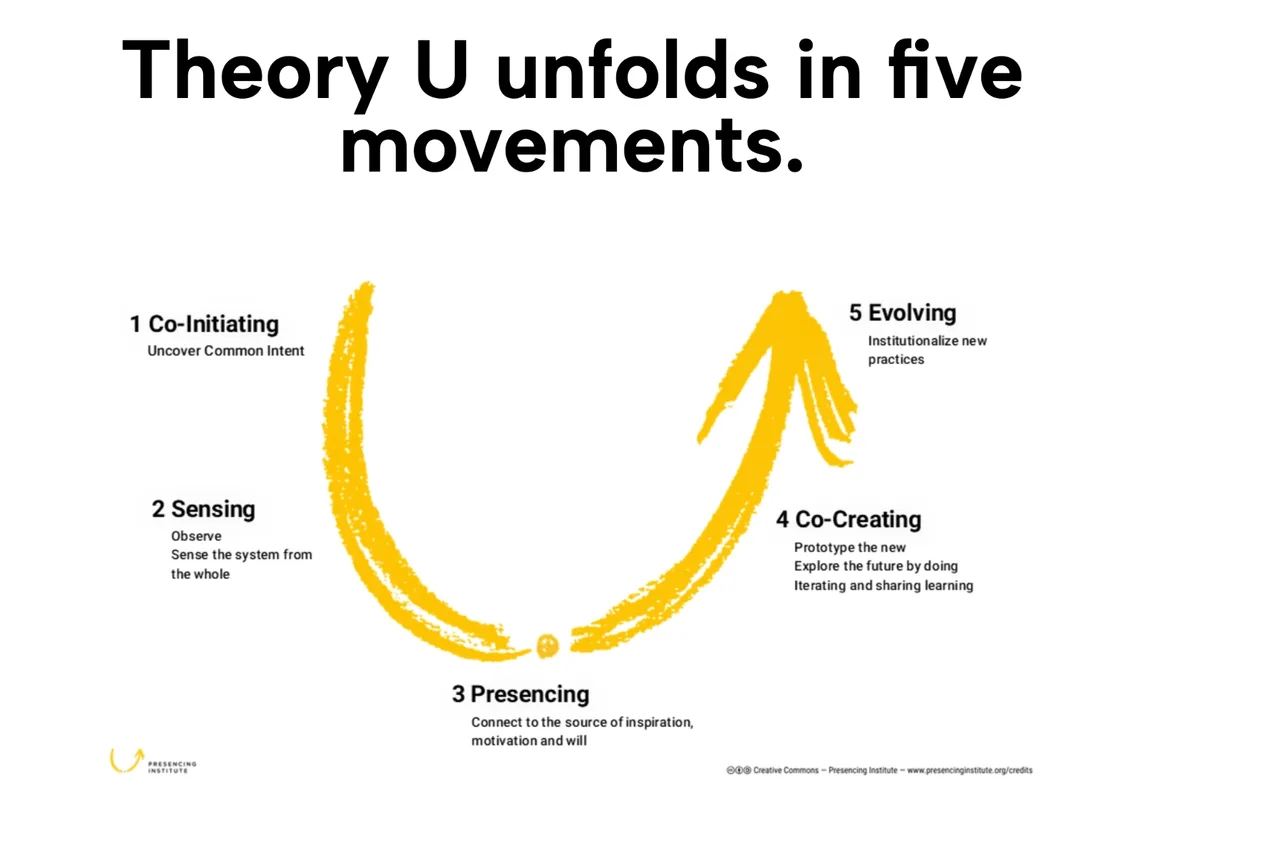
“As we move down the left side of the U, we allow ourselves to connect with the world outside our organizational bubble. Reaching the bottom of the U, we suspend our common assumptions and thinking, letting come our highest future possibility. Finally, as we ascend the right side of the U, we bring forth the new into the world.”
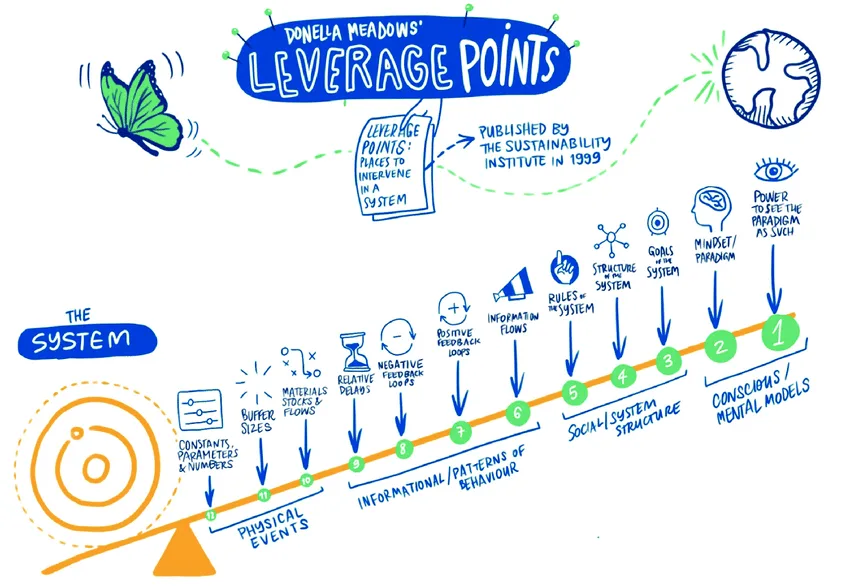
Leverage points. Donella Meadows identified the places where a small change can shift a whole system. Among the most powerful are a system’s goals: what it is trying to achieve. Future Streets works at that level, asking people what they want their streets and neighbourhoods to be for.
Doughnut Economics and the Embedded Economy. Kate Raworth’s model describes a safe and just space where everyone can thrive: above a social foundation everyone needs, and within the planet’s ecological limits. Our use of “thriving” is a nod to that goal. Streets touch both sides of the Doughnut at once, from health and social connection to air quality, green space and carbon.
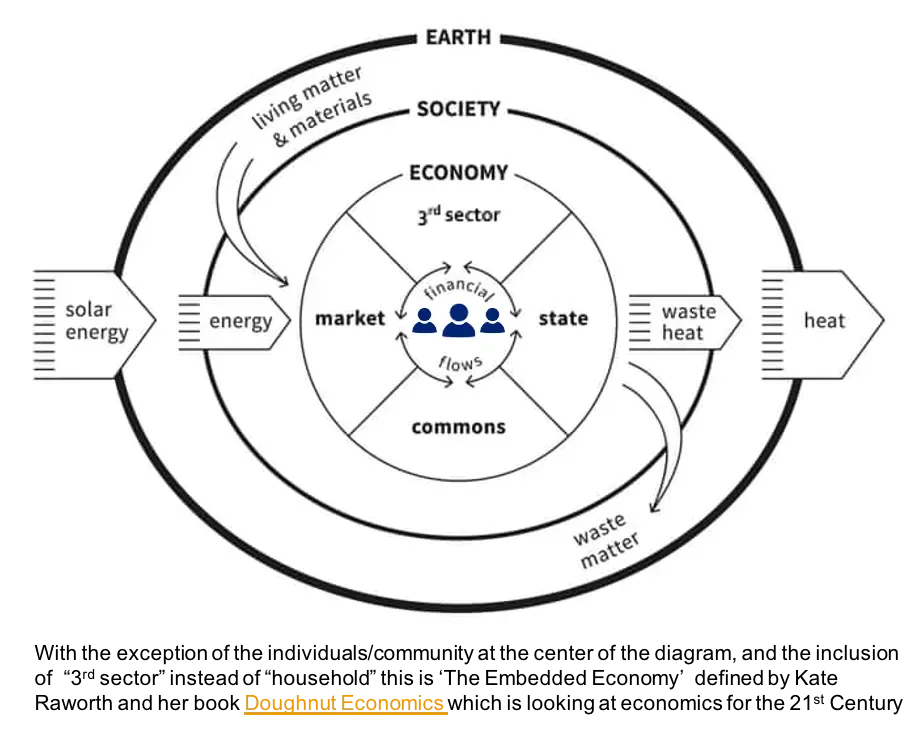
Raworth also describes the economy as embedded in society and the living world. Change isn’t a deal struck between the market and the state. Households, communities and the commons, businesses and government all have a role to play, and they work best in relationship. We convened Workshop 5 with this in mind, bringing together residents, community and environmental groups, businesses and people in local government.
Further reading: Scharmer, Theory U (2009); Meadows, Leverage Points: Places to Intervene in a System (1999); Raworth, Doughnut Economics (2017)
Where does this work go from here?
On 12 November, Workshop 5 brings together people from across Oxfordshire who each have a part to play in how our streets and neighbourhoods change: residents, community connectors and civil society leaders, councillors, senior council leaders and officers, public health, environmental organisations and businesses. Together we’ll ask: how might this work be useful to you now? What conditions need to be in place to work holistically across all six themes of the wheel, with civic voice at the heart? And what would you like to see happen next?
This site will grow as the work does. We’ll share what comes out of Workshop 5 and how the work is being taken up.
The indicators, themes and factors stand on a solid foundation, but we’re keeping an open mind about how this work travels. The themes, factors, and indicators can be refined or built on, or the indicators paired with trackable metrics. New indicators can be drawn from the material we already have, or from new conversations in new places. They can work at different scales, for a whole council area, a town, a neighbourhood or a single street. And if more places want to take part, the body of evidence behind them can grow, place by place. The methodology itself can be scaled up or down.
Everything Future Streets has produced belongs to everyone. That includes:
- the indicators, and the themes and factors behind them
- what people told us: their hopes, their “what if?” questions, the collages and illustrations
- the method: how we designed the workshops, tracked who was taking part, and tested the indicators with a wider group
All of it is free for any community, organisation or place to use and build on.
How you could use it
- Advocacy. A shared, community-authored picture to make the case for change, whether you’re a campaign group, a parish council or a residents’ association.
- Collaboration. A common starting point for groups who want to work together on a street or neighbourhood.
- Partnership. A reference point for councils, health, business and community organisations as new ways of working take shape across Oxfordshire.
- Neighbourhood plans. Community-led input for places writing or reviewing their plans.
- Measurement. A way to notice and track change at street and neighbourhood level, alongside official data. Trackable metrics can also be developed for each indicator, working with local councils.
- Running your own process. The method can be scaled up or down: a full workshop series, a single community conversation or a school assembly.
A good place to start is with one indicator and one place. Ask what it would take to make it true where you live or work, and who would need to be involved?
If you’d like to use any of this work, or work with us on what comes next, get in touch with Siobhann directly at siobhann@oxfordshireliveablestreets.org.